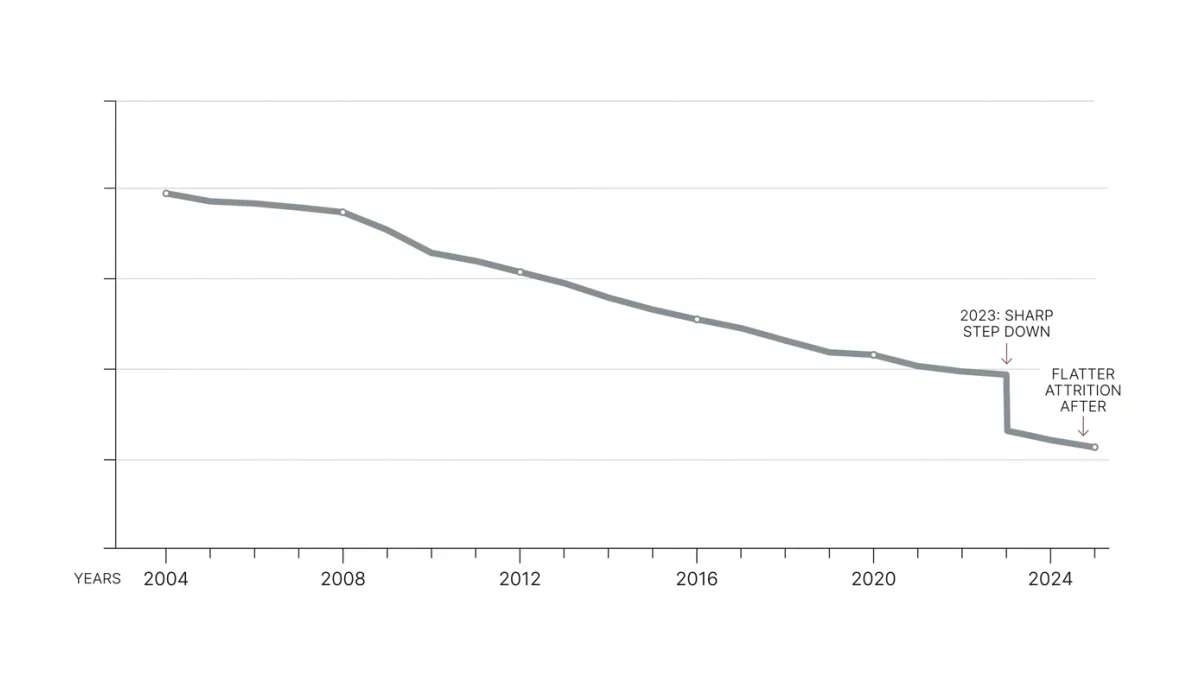
US newsroom employment has fallen on the order of 60 percent from its early-2000s peak — from roughly 75,000 newspaper journalists to below 30,000, per Pew Research Center's industry analyses — and annual layoff tracking through the 2020s has recorded thousands of journalism job cuts in the worst years, with 2023 standing out in the trackers' data as one of the worst on record before the pace eased. Those are the honest headline numbers. But an aggregate layoff count is a blunt instrument, and reading it as simple shrinkage misleads on three counts that matter to anyone planning a media career or a media business.
Licht Journal publishes information and analysis, not career advice; figures are from named industry trackers and academic research.
What the aggregate number hides
First, composition: newspaper cuts dominate the counts, while digital-native newsrooms grew for most of the same period — the collapse is a sector rotation from print institutions to digital ones, not a uniform die-off. Second, geography and function: closures and cuts concentrate in small markets and in production, sales and print-side roles, while data, product and audience functions grew even at shrinking organizations — the industry cut where the model died and hired, thinner, where the new model lives. Third, the survivor bias of visibility: the layoffs that trend are at famous national outlets; the routine attrition at the thousands of small papers — a departure not replaced, a paper quietly merged — never trends but constitutes most of the lost headcount in the academic censuses.
What drives the cuts — and what doesn't
The first-order driver is structural: print advertising and circulation revenue declined for two decades, and headcount is a cost line that follows revenue. That explains the long slope. The spikes — the worst layoff years clustering in downturns (2008-2009, 2020, 2022-2023) and in the years after leveraged acquisitions — show the second-order drivers: macro advertising cycles, and ownership financial structures in which acquired newsrooms carry their acquirers' debt. The tracker data and the academic literature both associate the deepest cuts with private-equity-adjacent ownership structures, a pattern contested by the owners and consistent in the research. What does not drive the cuts, despite the discourse: AI as a mass replacement of journalists is, as of the mid-2020s, a marginal factor in the counts — the layoffs preceded it by two decades and continue for the same structural reasons, though licensing-and-automation pressure is now a live second-order risk worth monitoring.
What does the re-sorting mean practically?
For job-seekers: the skills in demand concentrated in the growth functions — audience, product, data, audio and video production, newsletter editing — and in the growth institutional forms: nonprofit newsrooms, B2B and trade information, newsletter-native operations. For operators: the labor market consequence of two decades of cuts is that experienced editorial talent is available and mission-motivated, which is part of why new newsroom formation (digital start-ups, nonprofits, local cooperatives) continued even through the worst layoff years — the sector's problem was never the supply of journalists, it was the supply of business models that could employ them. That distinction — talent abundant, models scarce — is the single most decision-relevant fact in the whole layoff file.
What generalizes?
That the aggregate numbers describe a structural transition whose end state is not yet visible: fewer, differently-organized newsrooms, funded differently, employing a smaller total number of journalists distributed differently across markets and beats. The honest read treats the layoffs as the visible friction of that transition rather than as a verdict on the profession. What does not generalize: extrapolations from any single year's count — the pace moves with the advertising cycle and ownership events, and both cut both ways — and the frequently drawn conclusion that no one will pay for journalism, which the subscription, membership and nonprofit growth documented elsewhere in this industry's data refutes quarter after quarter.